What Is a Good Engagement Rate? Benchmarks by Platform
Stop building revenue projections on hope. Learn how to use real engagement rate benchmarks and platform-specific data to create accurate financial models that actually work.
This article was last updated on
Details
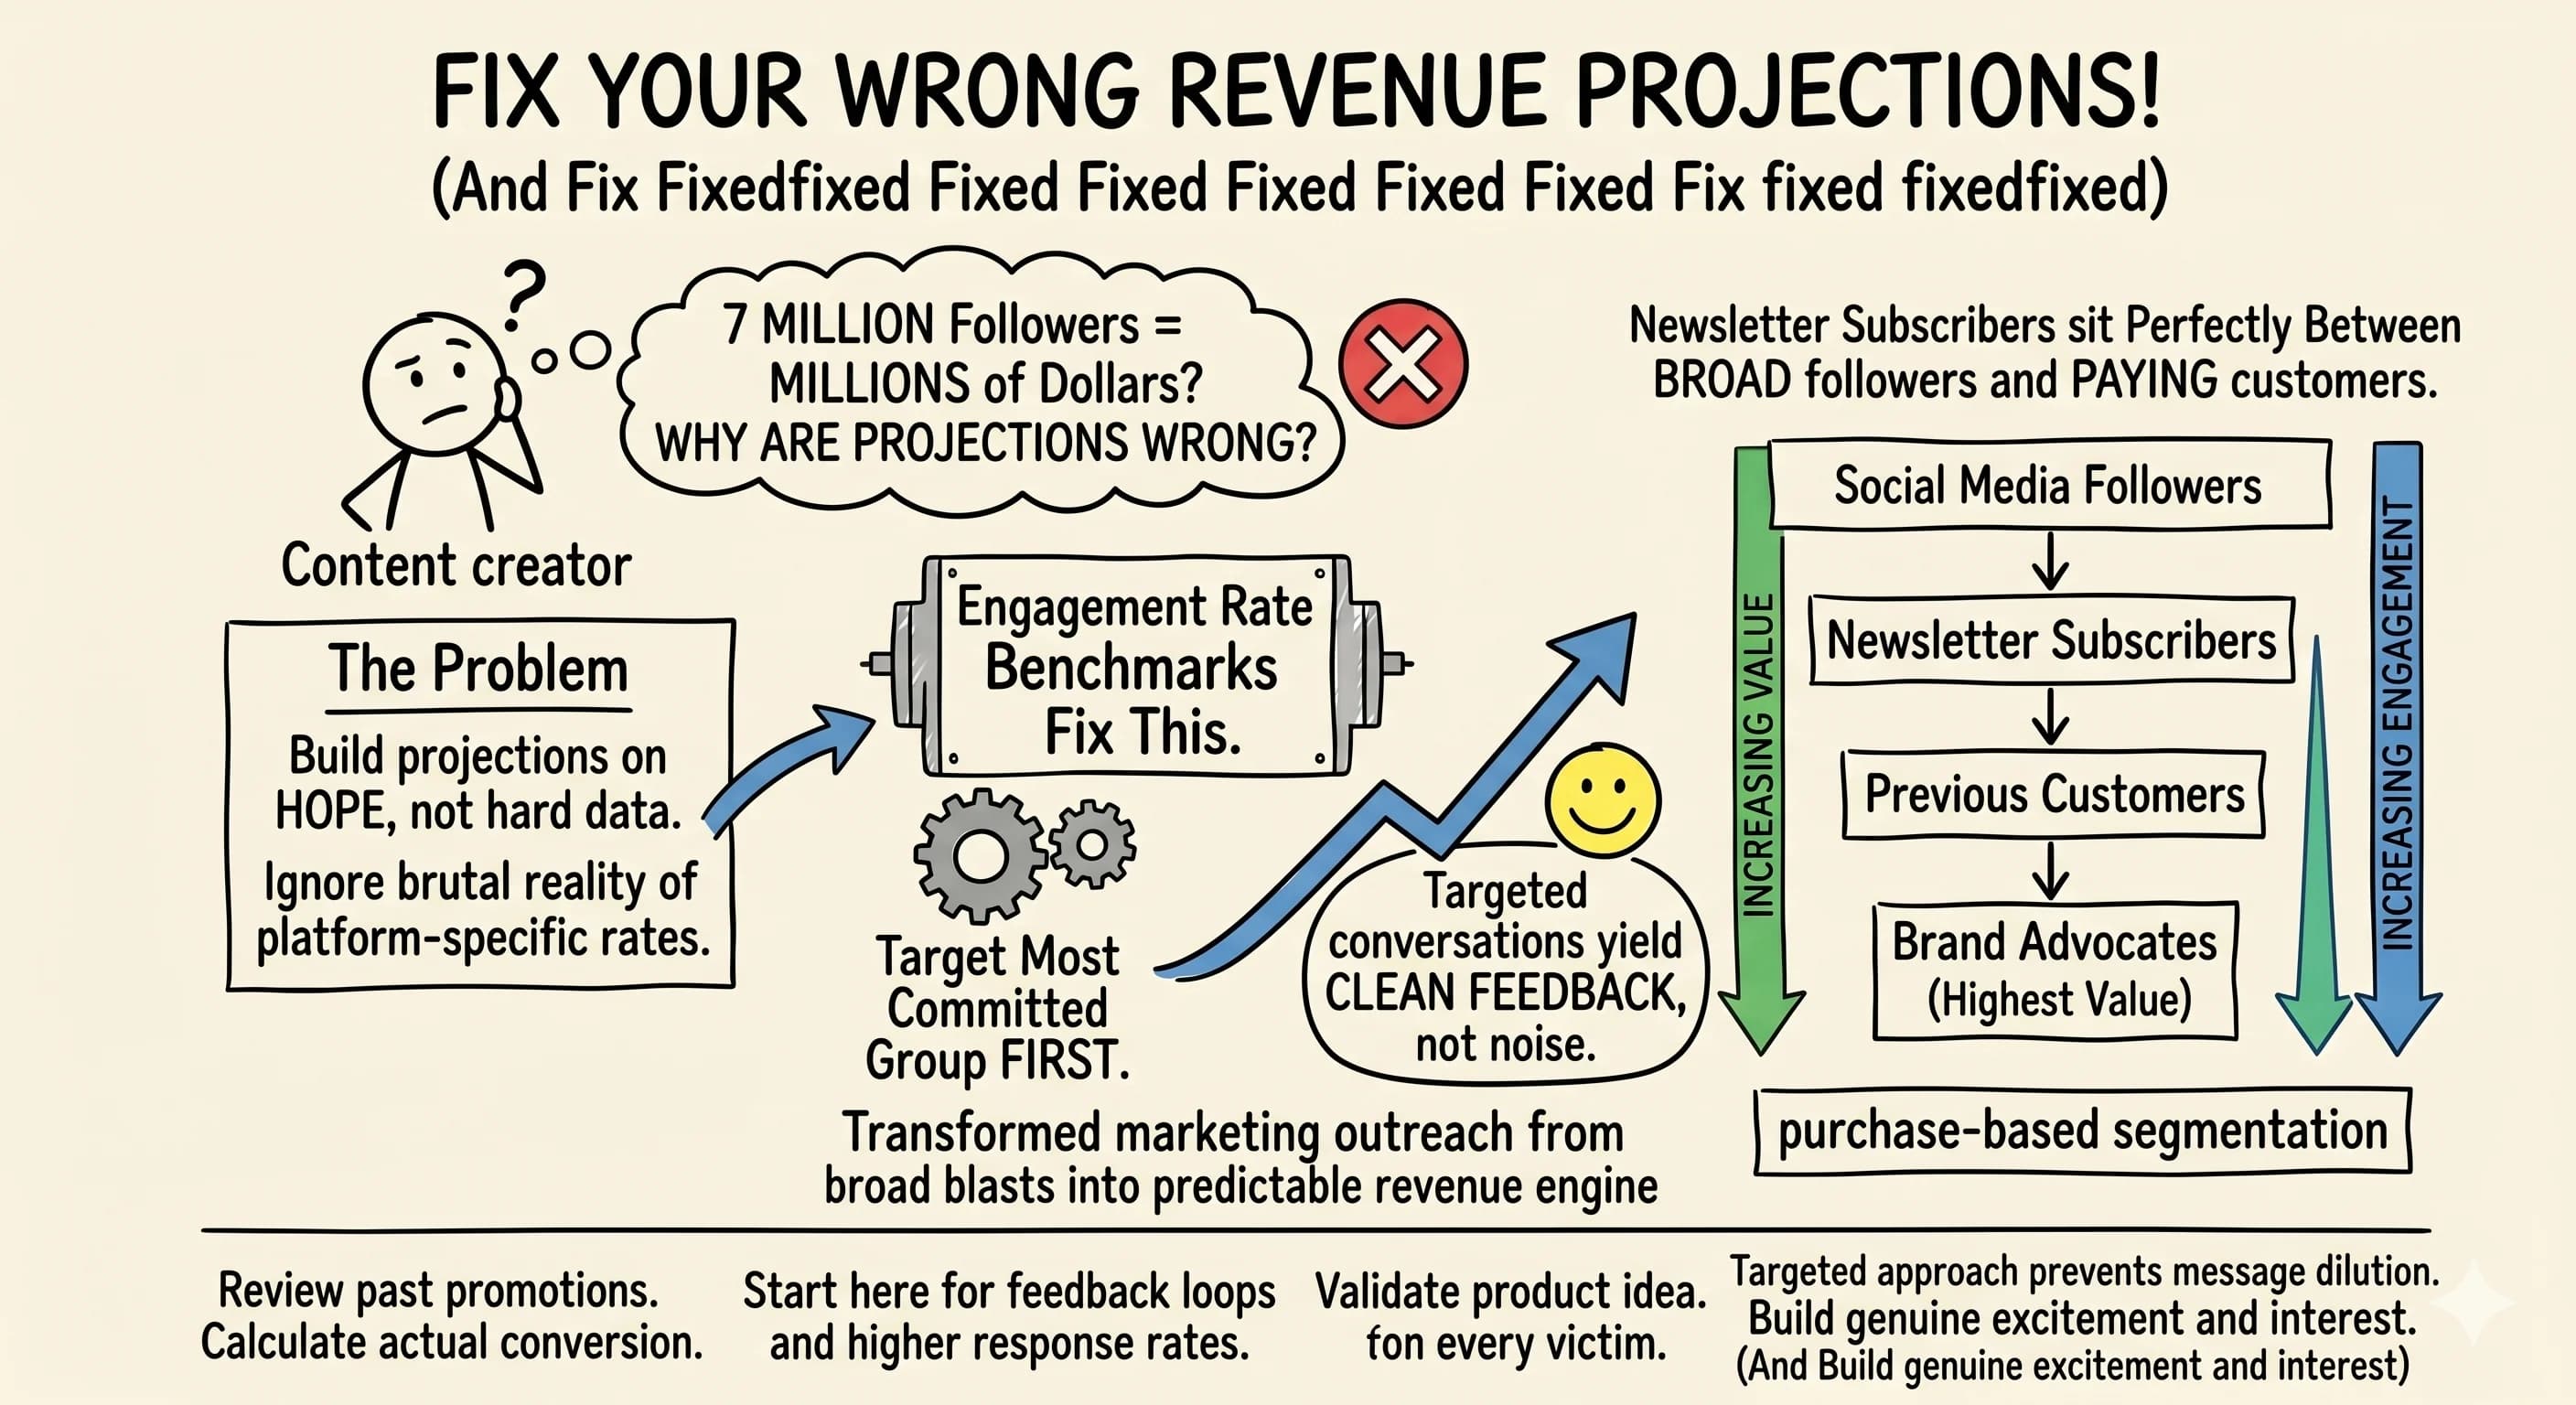
Most content creators build their financial projections on hope rather than hard data. You're assuming every follower will convert, ignoring the brutal reality of platform-specific engagement rates, and then wondering why your bank account doesn't match your spreadsheet. But there's a better way.
What Is a Good Engagement Rate?
A good engagement rate is the percentage of your audience that actually interacts with a post (likes, comments, shares, saves) instead of just scrolling past. As a quick rule of thumb, the average engagement rate across social media sits in the low single digits, so anything above roughly 3% is generally considered a good engagement rate. But the honest answer depends on your platform and your follower count:
- Instagram: averages around a 3% engagement rate, so a good Instagram engagement rate is at or above that.
- TikTok: sits around 1.8% on average, though standout Reels-style videos go much higher.
- By creator size: micro-influencers (1K-10K) average 3-7%, mid-tier creators (10K-100K) 1-3%, and large creators (100K+) 1-2%.
Those industry benchmarks are only the baseline. As you'll see below, your own engagement rate benchmarks matter far more than any average, especially once you use them to predict revenue.
Transform Your Social Media Engagement Data Into Revenue Predictions
 Successful creators understand that followers don't equal dollars. Take micro-influencer Sarah Chen, who built a profitable business with just 8,000 TikTok followers by tracking her actual conversion rates. Instead of assuming all her followers would buy, she analyzed her click-through rates from previous promotions and discovered only 2.8% of her audience typically engaged with sales posts, and just 4% of those converted to purchases.
This gave her a realistic baseline: with 8,000 followers, she could expect about 224 engaged users per promotional post, leading to roughly 9 sales. Not massive numbers, but predictable revenue she could count on.
Start by examining your historical engagement data. Look at click-through rates from previous promotions, conversion rates from past product sales, and newsletter signup rates. If you have 10,000 followers on TikTok and typically see a 3% engagement rate, that's 300 engaged users per post. If 5% of those engaged users convert to customers, you're looking at 15 potential sales, not 10,000.
Platform-Specific Engagement Benchmarks
 Different platforms yield dramatically different engagement rates, and understanding these nuances is crucial for accurate financial modeling. LinkedIn typically sees higher conversion rates for professional products, while TikTok excels at driving awareness but may have lower purchase intent.
Current engagement rate benchmarks show significant variation across platforms. Instagram averages around 3% engagement rate, while TikTok sits at approximately 1.8%. However, these averages don't tell the whole story about your specific audience.
Good Engagement Rate by Creator Size
You've probably wondered, "Is a 7% engagement rate good?" or "Is a 20% engagement rate good on Instagram?" The answer depends entirely on your audience size and niche. Here's what current data shows:
- Micro-influencers (1K-10K): 3-7% average engagement
- Mid-tier creators (10K-100K): 1-3% average engagement
- Large creators (100K+): 1-2% average engagement
Creator Maya Rodriguez discovered this firsthand when she hit 50,000 Instagram followers. Her engagement rate dropped from 6% to 2.5%, but her actual revenue increased because she'd learned to focus on quality engagement rather than vanity metrics.
How to Calculate Engagement Rate and Build Financial Models
 To calculate a creator's engagement rate, divide total engagement (likes, comments, shares) by follower count, then multiply by 100. That is the standard engagement rate formula: engagement / followers x 100. Some creators divide by impressions or reach instead of follower count for a truer number, and any engagement rate calculator or your native analytics can run this automatically. But don't stop there. Use this metric for financial planning by following this proven framework:
- Gather Historical Data: Analyze engagement rates across platforms over the past 6 months
- Map Your Funnel: Track conversion from total followers to engaged audience to actual purchasers
- Apply Realistic Benchmarks: Use proven audience behavior patterns, not optimistic assumptions
- Factor in Platform Differences: Adjust projections based on each social network's characteristics
- Include Churn Rates: Account for customer retention in recurring revenue models
- Calculate Profit Margins: Don't forget costs when projecting revenue
Creator Alex Thompson built his entire business model this way. He tracked that his LinkedIn posts averaged 4.2% engagement, with 8% of engaged users clicking through to his landing page, and 12% of those converting to his course. With these numbers, he could predict that a post to his 25,000 LinkedIn followers would generate approximately 10 course sales.
Implementing Social Media Benchmarking Across Platforms
 Create separate models for each platform where you're active. Your LinkedIn engagement benchmarks will differ significantly from your TikTok performance. Use cohort analysis to project revenue over 6-12 month periods, allowing you to see how different marketing strategies perform across social networks.
Consider the case of fitness creator James Park, who discovered his YouTube engagement rate of 2.1% converted to sales at nearly double the rate of his Instagram engagement. This insight led him to shift 60% of his promotional content to YouTube, increasing his monthly revenue by 40% without gaining a single new follower.
Factor in platform-specific behaviors. TikTok users might engage heavily but convert slowly, while LinkedIn users engage less frequently but convert at higher rates when they do. Financial services brands, for example, see Instagram engagement rates around 3.8% and LinkedIn at 3.2%, but LinkedIn typically drives more qualified leads.
Building Your Marketing Strategy
As you plan, focus on improving your social media engagement through data-driven decisions. To improve your engagement rate, lean into the content formats your audience rewards (Reels and short video usually earn the highest engagement rate), reply to every comment, and track which posts beat your own benchmark. Rather than chasing vanity metrics, concentrate on the engagement data that actually converts to revenue.
Test and validate your assumptions regularly. Creator Emma Williams discovered her engagement rates fluctuated seasonally, with December showing 40% lower conversion rates despite similar engagement. This insight helped her adjust her financial projections and avoid cash flow problems.
Start building your financial model today using real engagement rate benchmarks. Review your past promotions, calculate actual conversion rates, and create realistic projections. This approach transforms your content strategy from guesswork into a predictable revenue engine, ensuring your financial goals are both ambitious and achievable.
Remember, you're not trying to optimize for the highest engagement rate. You're optimizing for the most profitable engagement that converts to sustainable revenue. That's the difference between creators who struggle financially and those who build lasting businesses.
Read more about Monetization & Business Models for Content Creators
📚 Complete Guides
- Content Creator Monetization Proven Revenue Streams
- 7 Revenue Streams Every Content Creator Needs To Build Financial Stability
⚡ Tactics & Strategies
- Email Newsletter Convention-Breaking Long-Form 1500-Word Format with White Space Structure
- Community-First Creator Sourcing to Maximize Small Influencer Budgets
- Targeting Most Engaged Audience Segments for Product Feedback
- Optimizing the Newsletter About Page with Clear Value Proposition to Convert Visitors into Subscribers
- Branded Daily Newsletter Format - Awarding 'The Best of the Day' to Make Curated Content Feel Prestigious
📄 Related Articles
- How to Generate $10K Monthly with 30 Daily UGC Brand Pitches: A Creator's Outbound Strategy
- How to Monetize Your Podcast Without Waiting for Sponsorships
- Turn Instagram Followers Into Email Subscribers With Algorithm Frustration
- Community Platform Integration: The Game Changer for Online Course Creators
- How to Grow Your Email List with Instagram's Commenter Spotlight Strategy
- Engaged Subscribers Already on Your Email List Are Your Best Growth Asset
- Audience Segmentation for Content Creators: Target Your Most Engaged Newsletter Subscribers First
- Welcome Email Sequence: Best Examples to Convert New Subscribers
🧮 Calculators
Alex Kirillov
Details
One link. Every channel, rate, and piece of work brands need to evaluate you. Built for how creators actually get hired.
Claim your profile
Live creator, content, and marketing roles from real companies, with the pay, market, and context the raw job page never gives you.
Browse jobs